Schools
Check Out How Your Batavia School Is Doing
At-A-Glance Report Cards and full reports cards for each Batavia school are now on the Illinois School Board website.
The Illinois State Board of Education (ISBE) released new school and district report cards today (Thursday, Oct. 31, 2013). The report cards for Batavia School District 101 and each of its eight schools can be found here.
The report cards offer information on student demographics and performance but look dramatically different than in previous years. The online report cards now include a variety of new components, including tables showing how much academic progress students have demonstrated from one year to the next in reading and math.
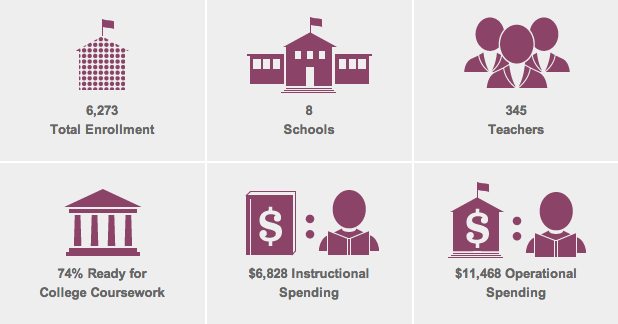
In addition, ISBE has released an At-a-Glance Report Card, which offers a two-page snapshot of each school and district.
As of noon Thursday, School District 101 has yet to add the 2013 report cards to its Report Cards page, but you can see the full reports here.
Click on the links below to see how your school is doing.
Students Who Meet Expectations
- BATAVIA SR HIGH SCHOOL: grades 9-12 — 74.5%
- SAM ROTOLO MIDDLE SCH: grades 6-8 — 76.2%
- ALICE GUSTAFSON ELEM SCHOOL: grades K-5 — 75.9%
- GRACE MCWAYNE ELEMENTARY SCHOOL: grades K-5 — 86.6%
- H C STORM ELEM SCHOOL: grades K-56 — 9.3%
- HOOVER WOOD ELEM SCHOOL: grades K-5 — 77.1%
- J B NELSON ELEM SCHOOL: grades K-5 — 77.5%
- LOUISE WHITE ELEM SCHOOL: grades K-5 — 79.3%
This spring, the State Board raised performance expectations — or cut scores — on the reading and math portions of the Illinois Standards Achievement Test, given to third through eighth graders. This change in cut scores is intended to provide greater alignment with the more rigorous Common Core Learning Standards and give a better indication of college and career readiness.
Due to these changes, many school officials recommend exercising caution in trying to draw conclusions comparing this year’s performance on the ISAT to last year’s ISAT performance.
Also this past spring, students and staff participated in the inaugural 5 Essentials learning conditions and school climate survey. A summary of the raw survey data and participation rates can also be found on this year’s report card for the district and for each school.